How to budget school and university maintenance costs by building system
Key Highlights
- Use equipment inventories, condition assessments and repair histories to build budgets around the assets being maintained.
- The contractor-weighted median annual HVAC and mechanical spend is $29,120 per education building, with substantial variation across buildings and contractor portfolios.
- Match pricing units to the service: cleanable square feet for custodial work, elevator count for elevator contracts, and equipment or labor measures for other trades.
- Review work orders, approved scope, invoices and change orders monthly to identify billing discrepancies while details are fresh.
- Keep routine maintenance budgets separate from capital-renewal reserves for major replacements such as roofs, chillers and switchgear.

Every spring, K-12 and higher-education facility directors face the same budgeting trap. A district or university rolls last year’s maintenance spend forward by 3 percent or applies a flat cost per gross square foot across an entire campus portfolio, from a 1970s elementary school to a university science building. Then July arrives, summer mechanical retrofits run past schedule, emergency chiller and roof repairs pile onto annual service contracts, and capital reserves absorb the overrun.
As explored in AS&U’s recent article, “Stop Managing Facilities One Emergency at a Time,” moving from reactive spending to planned maintenance and capital renewal can make institutional budgets more predictable.
Benchmarking campus operations and maintenance works best when facility leaders separate two distinct questions: what comparable institutions spend per building or per covered asset, and whether incoming contractor invoices match the physical scope approved on site.
Why square-foot maintenance budgets can miss actual costs
A single cost-per-square-foot figure may be useful for estimating broad facilities operating expenses, but it is not necessarily the best basis for pricing individual maintenance contracts.
Different building systems generate costs in different ways. HVAC spending depends on equipment inventories, system complexity, service frequency and repair history. Elevator maintenance contracts typically reflect the number and type of elevators covered. Custodial services are more closely tied to cleanable area and service requirements.
The National Center for Education Statistics’ Planning Guide for Maintaining School Facilities recommends maintaining facility inventories, understanding equipment conditions and evaluating maintenance spending as part of a comprehensive facilities management program.
For schools and universities, that means developing budgets that reflect the assets being maintained rather than assuming that all building systems scale directly with gross floor area.
HVAC maintenance costs: What 2026 contractor benchmarks show
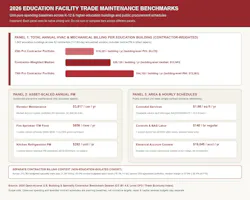
Heating, ventilation, and air conditioning represent one of the largest trade line items on any campus. In our 2026 national building dataset, 52 mechanical contractors serviced 1,542 education buildings, with each eligible building showing at least 183 days between its first and last completed job and total billed revenue annualized over that observed service window. Weighting each contractor with five or more education buildings equally, the contractor-weighted median total annual HVAC and mechanical spend (including both routine maintenance and billed repairs) is $29,120 per education building, with the middle half of contractor portfolios spanning $18,391 to $44,102.
Individual school and campus buildings vary more widely than portfolio averages. Across individual education buildings, median annual mechanical billing is $15,943, the 25th percentile is $6,276, the 75th percentile reaches $36,448, and the 90th percentile is $72,083. Because our dataset withholds a floor-area multiplier where small-versus-large subgroups do not separate at 95 percent confidence, facility teams should pair these observed baselines directly with each building’s equipment inventory and repair history.
Match FM contracts to the right pricing units
Outside mechanical work, forcing every facility trade onto gross building square footage introduces avoidable budgeting errors. Custodial contracts scale with cleanable interior area, elevator maintenance scales by car count, kitchen refrigeration scales by unit count, and building automation scales by scheduled technician hours.
Public procurement documents can provide useful reference points when the pricing unit and service scope are clearly identified.
For example, a State of Michigan janitorial services contract includes a location-specific all-services rate of $1.66 per cleanable square foot annually. That figure applies to a particular government facility and service schedule, not to a representative sample of school districts.
Similarly, elevator contracts should be evaluated according to the number of covered elevators and the maintenance activities included. As discussed in AS&U’s guide to planning elevator modernization on an active campus, equipment condition, access requirements and the scope of modernization can significantly affect facility operations.
The following reference figures illustrate how trade-specific pricing units differ.
Table 1: 2026 Education and Public-Facility Trade Reference Benchmarks
Source note: Compiled from the 2026 open-access building and public-procurement benchmark dataset. Single-contract public schedules serve as transparent unit references rather than national survey medians; keep each trade in its native unit.
Why school maintenance budgets exceed contractor estimates
Setting realistic unit baselines solves only half the facility budget problem. Facility business offices also benefit from checking how seasonal work orders and reactive service calls are coded before invoices are paid.
In our separate operational dataset of specialty trade contractors (a commercial and institutional contractor cohort rather than an education-only sample), we examined 315,393 budgeted jobs across 1,391 companies. Actual labor hours exceeded budgeted hours on 40.0 percent of jobs, and 18.3 percent exceeded 1.5 times budgeted hours. In facility practice, tight school-break windows and unmarked ceiling utilities can turn verbal field directives into unpriced time-and-materials work unless change orders are documented promptly.
Paperwork timing and contract coding vary widely across contractors as well. Across 555 financial-closeout observations, the median time from work completion to recorded closeout is 1.7 days, while the 75th percentile reaches 9.6 days. Across 963 firms tracking job hours, median invoiced-to-logged hours is 97.1 percent (89.2 percent at the 25th percentile), and across 259 company portfolios with at least $10,000 in annual maintenance-agreement revenue, agreement gross margin is 37.9 percent at the median and minus 30.4 percent at the 10th percentile. (The 2026 Trade Economy Index provides additional information about these contractor operating distributions.)
Although those contractor distributions do not isolate owner billing errors, keeping covered preventive inspections on separate work-order codes from billable emergency repairs gives school business offices a clean audit trail.
A four-point monthly audit for campus maintenance invoices
Facility directors and business officials do not need new software to tighten trade spend before summer work begins. Running a four-point review between facilities operations and accounts payable each month catches billing drift while work orders are still fresh.
Table 2: Four-Point Campus Contractor Billing Audit Checklist
Separate preventative maintenance budgets from capital renewal reserves
A durable campus maintenance budget separates predictable scheduled care from episodic major capital expenditures. The baseline operating budget should reflect verified equipment counts and recurring service requirements for HVAC, custodial services, elevators, refrigeration, fire and life safety systems, and building controls. Repair allowances and multiyear replacements for roofs, chillers, switchgear and other major components should be tracked separately through dedicated capital-renewal plans.
A documented building condition assessment can help facilities directors identify which assets are approaching replacement, estimate future expenditures and establish funding priorities. Separating these expenses helps protect regular preventive maintenance from being consumed by an unexpected major repair.
One emergency compressor failure in August should not eliminate the funds needed to maintain equipment throughout the rest of the district.
About the Author
Sam Yang
Sam Yang is founder and managing partner of Level CFO, a New York accounting and financial operations firm serving commercial contractors. He spent seven years in contractor finance, including four years leading finance product for software used by 1,000+ specialty contractors, after $2.5B in PE and investment banking deals (Stanford MBA, Brown University; [email protected]).